Quantitative Finance
Equity Portfolio Optimization
Systematic construction using HRP, Max Sharpe, and Black-Litterman. Because guessing is expensive.
Chukwudalu Nobis-Elendu
Why this project
Retail investors often rely on news-driven stock picking, leading to unbalanced portfolios with high volatility. This project provides a disciplined alternative built to remove retail traders' guesswork: a tool that implements a 'barbell' selection strategy, systematically balancing high-momentum and low-volatility assets. By evaluating four distinct optimization models (Hierarchical Risk Parity, Maximum Sharpe Ratio, Maximum Diversification, and Mean-Risk Optimization) against market benchmarks, this tool replaces subjective decision-making with data-driven walk-forward backtesting.
Risk gauge
0–100 scorecard with barbell allocations.
Factor exposure
Factor tilts and diversification profile.
Correlation
Heatmap across regions and styles.
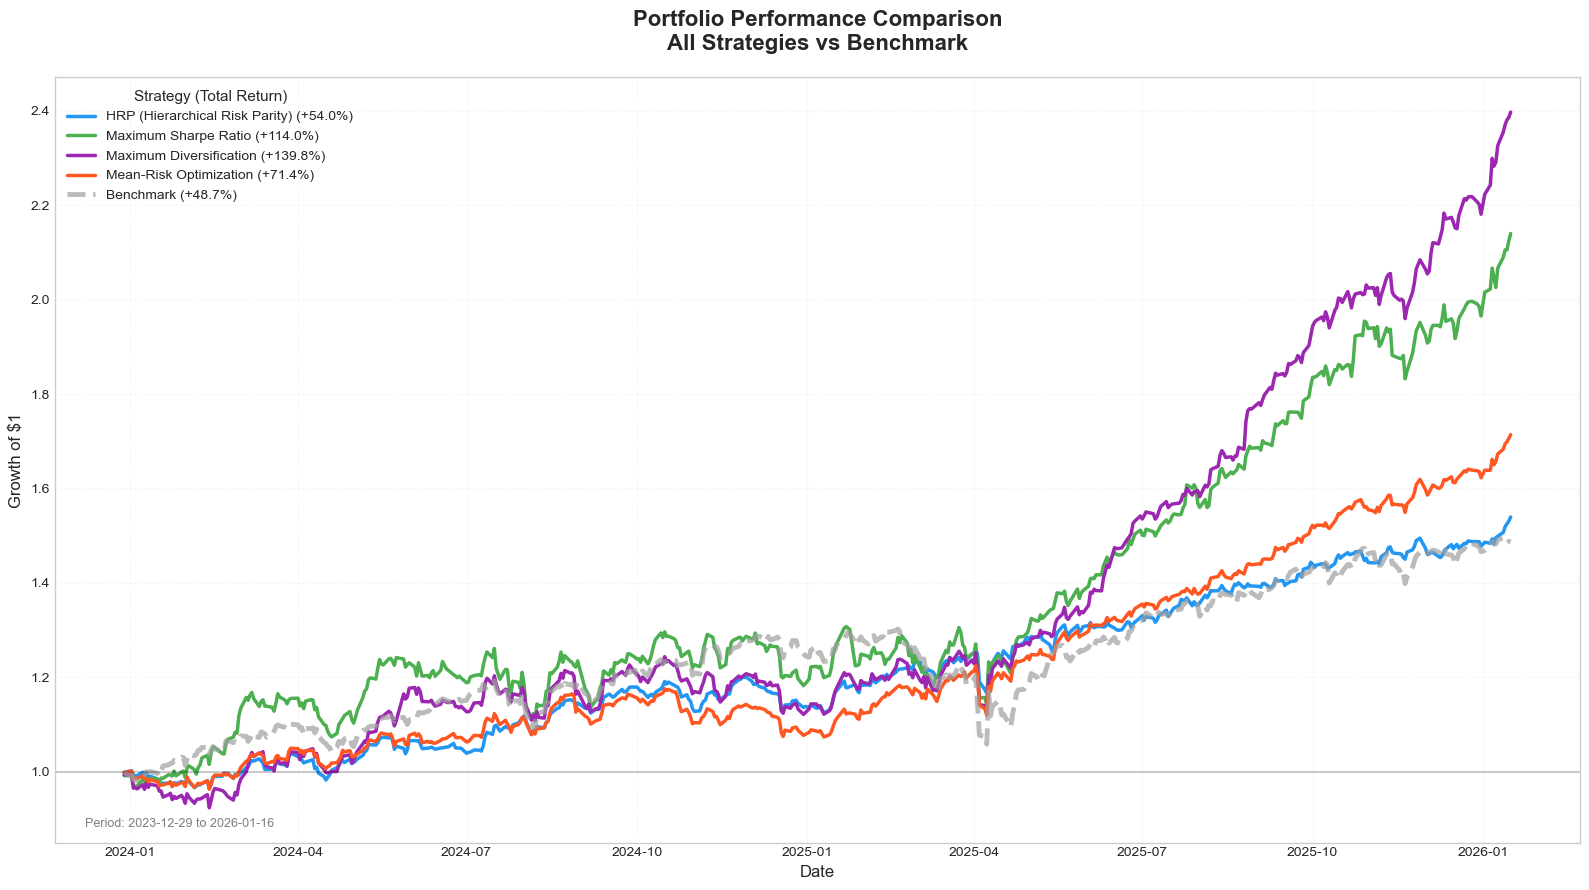
Performance
Walk-forward backtest vs benchmarks.
Risk contribution
Stability of HRP vs Max Sharpe.
Project summary
This portfolio optimization tool implements a systematic, quantitative approach to equity portfolio construction using modern portfolio theory and machine learning techniques. The system dynamically sources constituents from major global indices (S&P 500, FTSE 100, DAX, Nikkei 225, and others) and applies a "barbell" stock selection strategy combining high-momentum and low-volatility equities with configurable geographic diversification.
Four optimization strategies are evaluated through rigorous walk-forward backtesting: Hierarchical Risk Parity (HRP), Maximum Sharpe Ratio, Maximum Diversification, and Black-Litterman. The framework incorporates realistic transaction cost modeling, survivorship bias awareness, and generates comprehensive performance analytics including factor exposure analysis, risk contribution decomposition, and correlation heatmaps.
Highlights
- Four distinct optimization strategies compared side-by-side (HRP, Max Sharpe, Max Div, Black-Litterman).
- Realistic transaction cost modeling and survivorship bias awareness. No cheating the backtest.
- Comprehensive analytics: factor exposure, risk contribution, and correlation heatmaps.
Performance recap
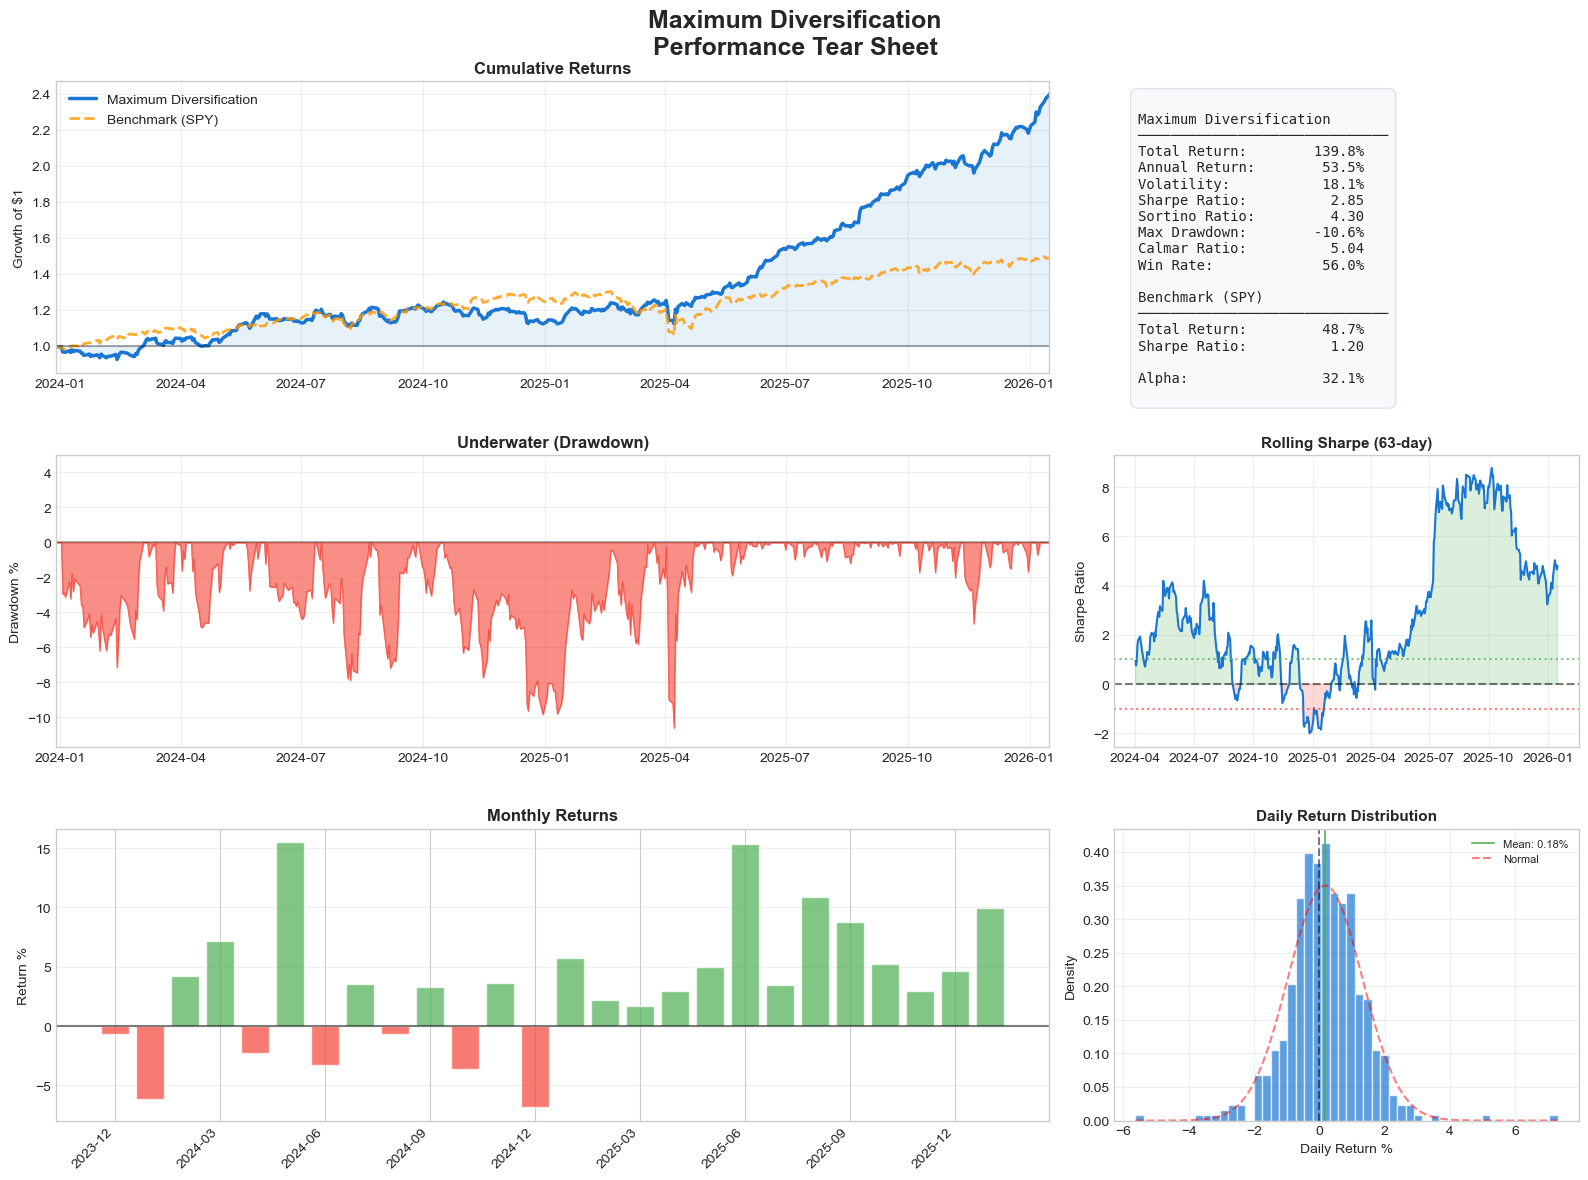
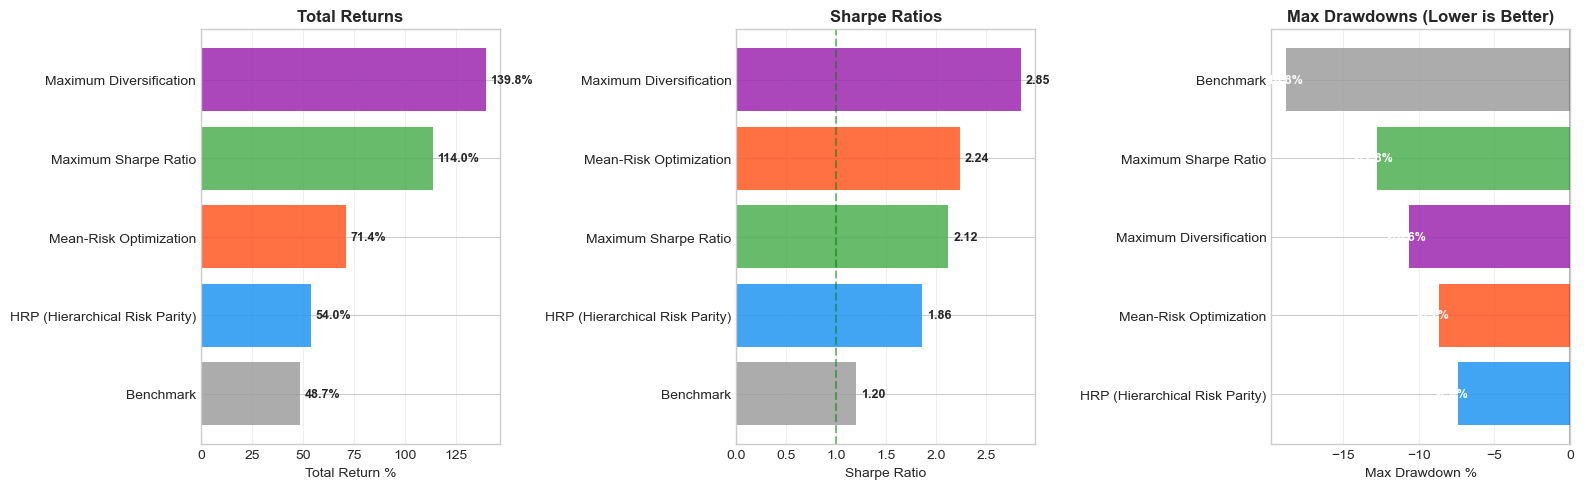
Winner: Maximum Diversification
- Strategy return: +139.8%
- Benchmark return: +48.7%
- Outperformance: +91.1%
Final performance table
| Strategy | Total Return | Annual Return | Volatility | Sharpe | Sortino | Max Drawdown | Calmar | Win Rate |
|---|---|---|---|---|---|---|---|---|
| HRP (Hierarchical Risk Parity) | 54.0% | 23.6% | 11.6% | 1.86 | 2.58 | -7.4% | 3.18 | 57.6% |
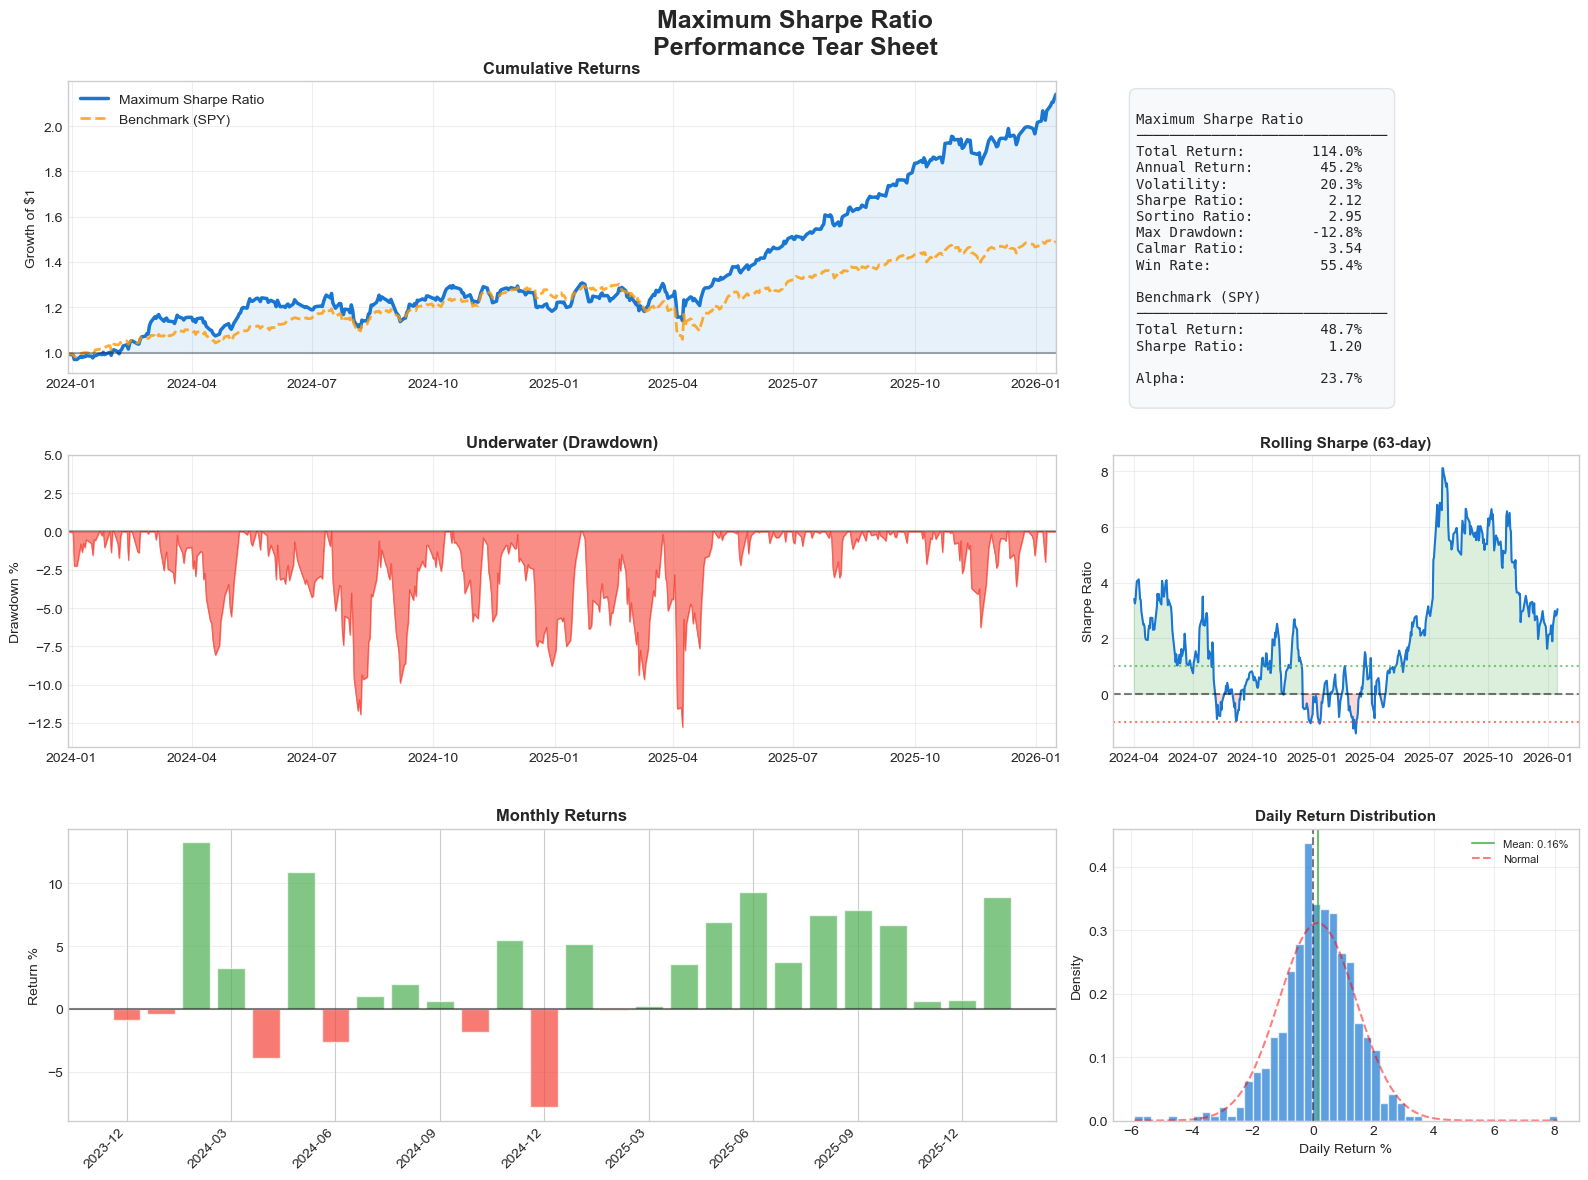
| Maximum Sharpe Ratio | 114.0% | 45.2% | 20.3% | 2.12 | 2.95 | -12.8% | 3.54 | 55.4% |
| Maximum Diversification | 139.8% | 53.5% | 18.1% | 2.85 | 4.30 | -10.6% | 5.04 | 56.0% |
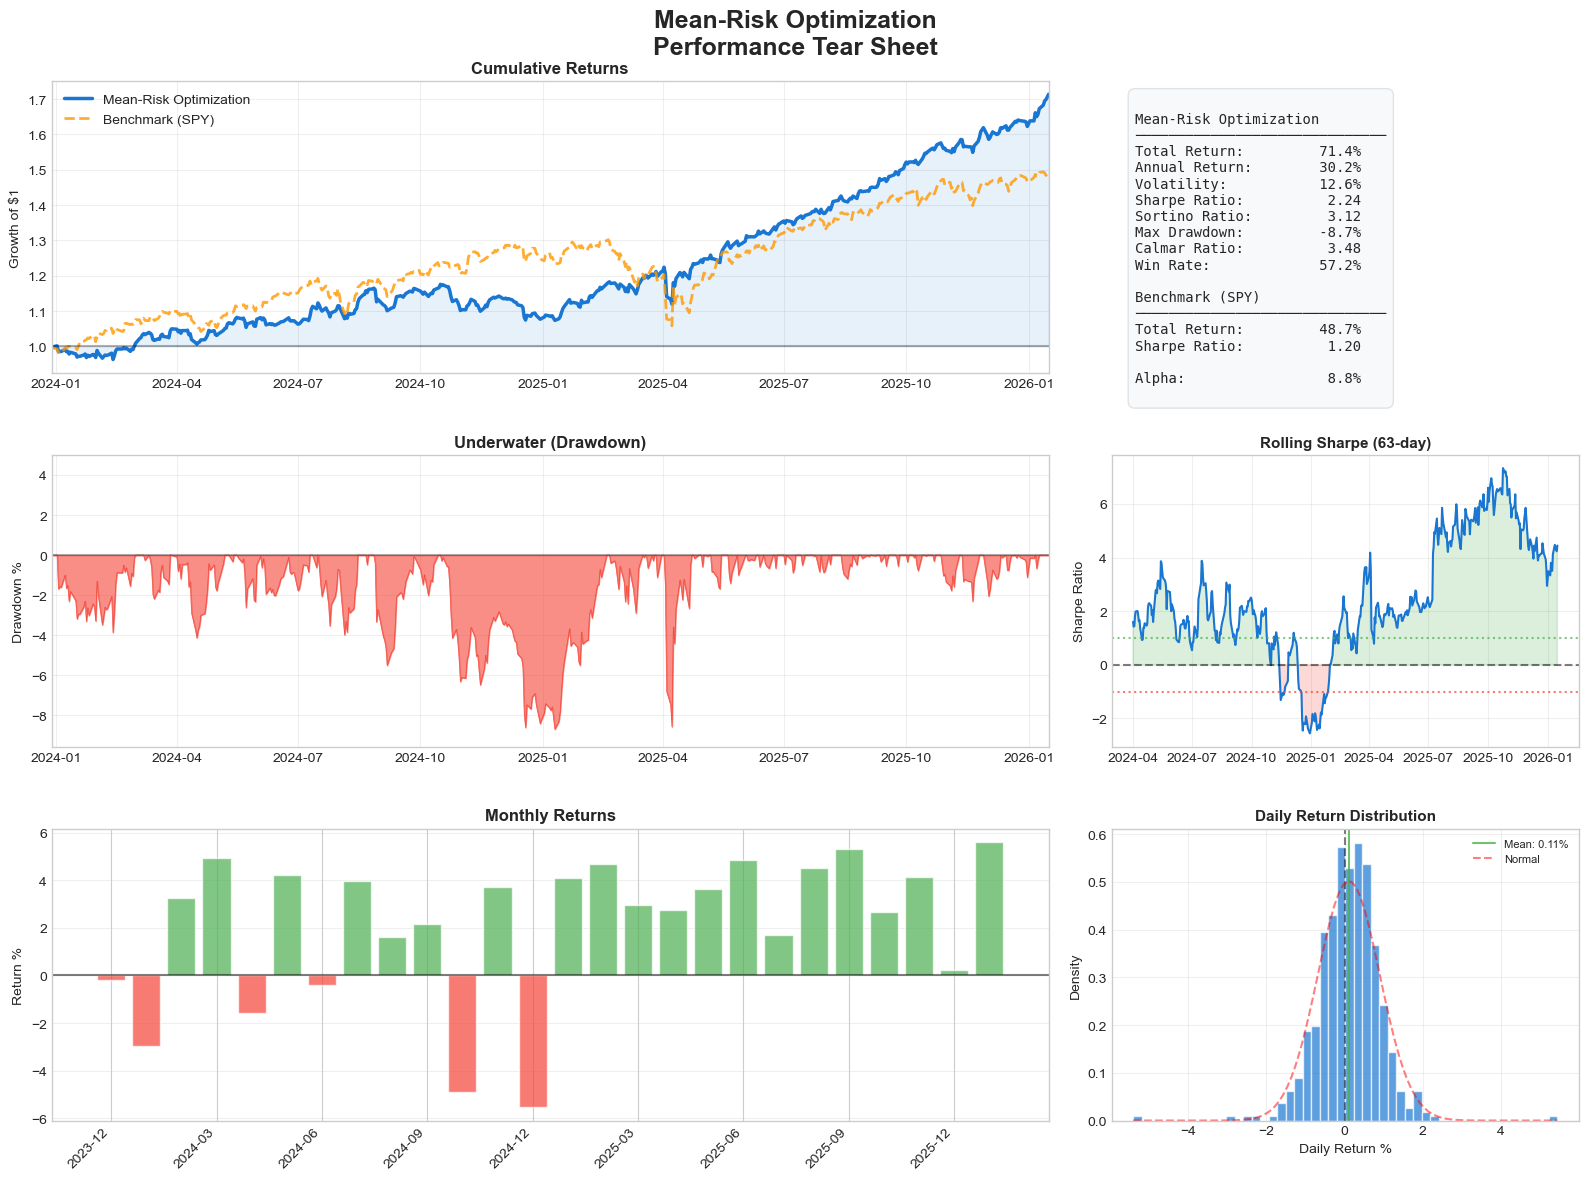
| Mean-Risk Optimization | 71.4% | 30.2% | 12.6% | 2.24 | 3.12 | -8.7% | 3.48 | 57.2% |
| Benchmark | 48.7% | 21.5% | 16.2% | 1.20 | 1.53 | -18.8% | 1.14 | 57.8% |
Tech stack
- Python
- Cvxpy
- Scipy
- Pandas
- Quantstats
Analytics & methods
- Walk-forward backtesting
- Hierarchical Risk Parity
- Mean Risk Optimization
- Factor analysis
Download a PDF with all references used for this project.
Download references